- Remove the current class from the content27_link item as Webflows native current state will automatically be applied.
- To add interactions which automatically expand and collapse sections in the table of contents select the content27_h-trigger element, add an element trigger and select Mouse click (tap)
- For the 1st click select the custom animation Content 27 table of contents [Expand] and for the 2nd click select the custom animation Content 27 table of contents [Collapse].
- In the Trigger Settings, deselect all checkboxes other than Desktop and above. This disables the interaction on tablet and below to prevent bugs when scrolling.
From Raw Numbers to Real Insight
Sports have never been more data-driven. Game video, GPS tracking, player loads, velocity-based training, force-plate outputs—the list grows daily. Coaches, sports scientists, and therapists are surrounded by numbers.
Take Major League Baseball (MLB), often cited as the most data-heavy sport. With Statcast alone, a single game produces around 7 terabytes of data, capturing both ball and player movement. Some teams even employ upwards of 20 data scientists just to make sense of it all.
But here’s the challenge: even with mountains of information, much of today’s data lacks context. Metrics like speed, load, or jump height are useful, but without interpretation they leave coaches guessing about the “why” and “what next.”
Where VueMotion Comes In
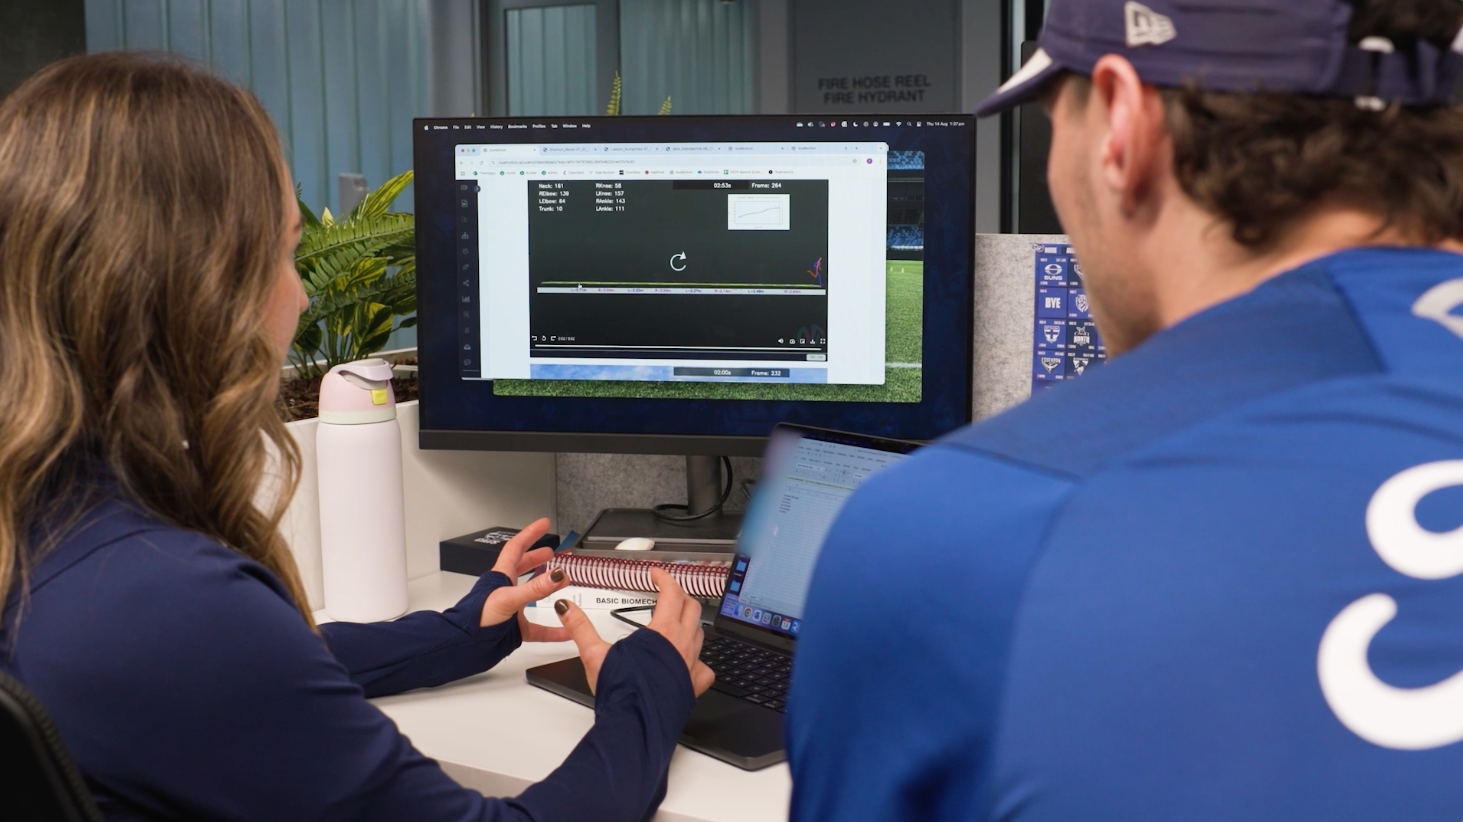
VueMotion is bridging that gap. By combining computer vision and machine learning with simple video capture, we transform raw movement into actionable insight—no wearables required. With just a smartphone, practitioners can assess detailed kinematics like step length, ground contact time, speed, and posture.
To make this data meaningful, we built a five-pillar framework designed to take coaches and athletes from numbers to knowledge to action.
The Five Pillars of VueMotion’s Framework
1. What It Is
Capture the metrics—step length, frequency, ground contact time, velocity, and joint kinematics. This is the foundation, but not the finish line.
2. What It Means
Numbers come to life with kinograms and visuals that show the motion behind the data. This context highlights issues like asymmetries or inefficient movement patterns, and why they matter.
3. Do They Understand It?
For change to happen, clarity matters. VueMotion uses annotated videos and images to communicate findings in a way that coaches and athletes alike can understand—building trust and buy-in.
4. What to Do About It
Insights become interventions. Whether it’s strength deficits, mobility restrictions, or motor control issues, VueMotion connects findings to evidence-based corrective strategies.
5. Is It Working?
Progress needs tracking. Our longitudinal reports show improvements—or setbacks—over time, giving both athletes and coaches accountability and confidence.
A Holistic Approach Rarely Seen in Sport
Most tools only touch one or two of these pillars. VueMotion covers all five, making it a rare end-to-end solution for performance and injury management. From identifying inefficiencies to guiding interventions and tracking outcomes, it delivers a complete picture.
Why It Matters Now
The fusion of video, AI, and biomechanics is changing how sport approaches both performance and injury prevention. Leagues like MLB continue to expand data collection systems, but tools like VueMotion bring the critical context to make that data actionable.
Validated for accuracy against high-end lab systems like Vicon and OptoJump, VueMotion is also more accessible and scalable—working on grass, sand, rinks, or pitches with just a phone. Today, it’s trusted by teams and organizations across multiple sports worldwide.
Bottom Line
Sport isn’t just about gathering data anymore—it’s about understanding it. VueMotion’s five-pillar framework is leading that shift, turning raw numbers into knowledge, and knowledge into better performance, fewer injuries, and healthier athletes.